AggreCount
An automated image analysis tool
![]()
About AggreCount
AggreCount is an automated image analysis macro written in the ImageJ macro language to be used with the FIJI distribution of ImageJ (v1.52p or later). This tool quantifies and localizes cellular aggregates in relation to the nucleus. It is intended for use with immunohistochemistry stains of in-vitro tissue cultures. While AggreCount was designed for analysis of aggregates, it may function well to quantify and localize any punctate structure found within cells such as lysosomes, peroxisomes, RNA stress granules etc. We are constantly improving AggreCount and welcome any feedback. Please contact Jacob Klickstein with any comments - jacob.klickstein@tufts.edu
Processing methodology
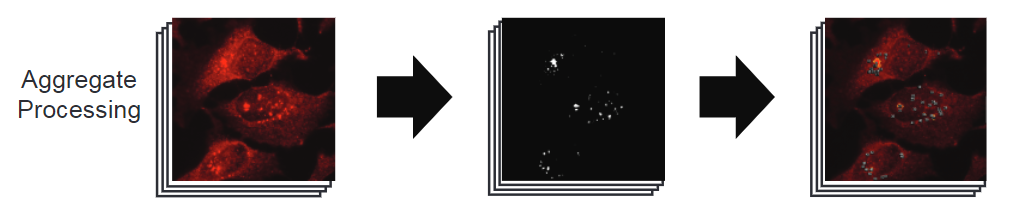
Aggregate processing
AggreCount processes aggregate immunohistochemical stains in 4 steps.
- Signal normalization Pixel intensities are normalized and contrast is enhanced. Normalization allows for the comparison between bright and dim images with a single threshold value.
- Gamma enhancement From the ImageJ documentation: “Gamma performs a non-linear histogram adjustment. Faint objects become more intense while bright objects do not (gamma <1). Also, medium-intensity objects become fainter while bright objects do not (gamma > 1). The intensity of each pixel is “raised to the power” of the gamma value and then scaled to 8-bits or the min and max of 16-bit images.” AggreCount utilizes a gamma value of 1.3, however, this may changed within the aggregate processing code
- Raw background subtraction of mean fluorescent signal To determine which pixels represent fluorescent signal, the contrast is greatly enhanced and normalized to boost the signal. Then the image is converted into binary and ROIs are captured. The mean pixel value within these ROIs in the original image is recorded as the mean fluorescent signal. One half of this mean is subtracted from the entire image.
- Difference of Gaussians The image from step 3 is duplicated and a Gaussian filter is applied with a sigma of 2.5 (scaled). This blurred image is subtracted from the pre-processed image to create an image with isolated puncta which is thresholded using a user-set value.
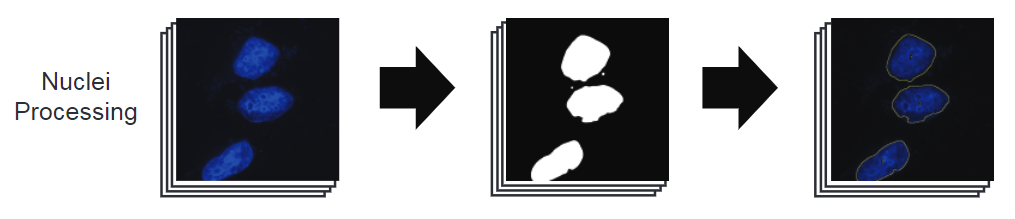
Nuclei processing
Nuclei fluorescent intensity is enhanced and normalized using the “enhance contrast” function in ImageJ. That image is thresholded and binarized automatically. Holes in the binary image are filled and is dilated. ROIs are captured from this image with a size cutoff to prevent small artefacts from being categorized as nuclei. The average size of nuclei is caluclated and used to determine whether a ROI contains multiple nuclei (IE the fluorescent signal from two or more nuclei blended together). This value is reported in the “nuclei” field within the individual data sheets as well as the “dataset_cells” file.
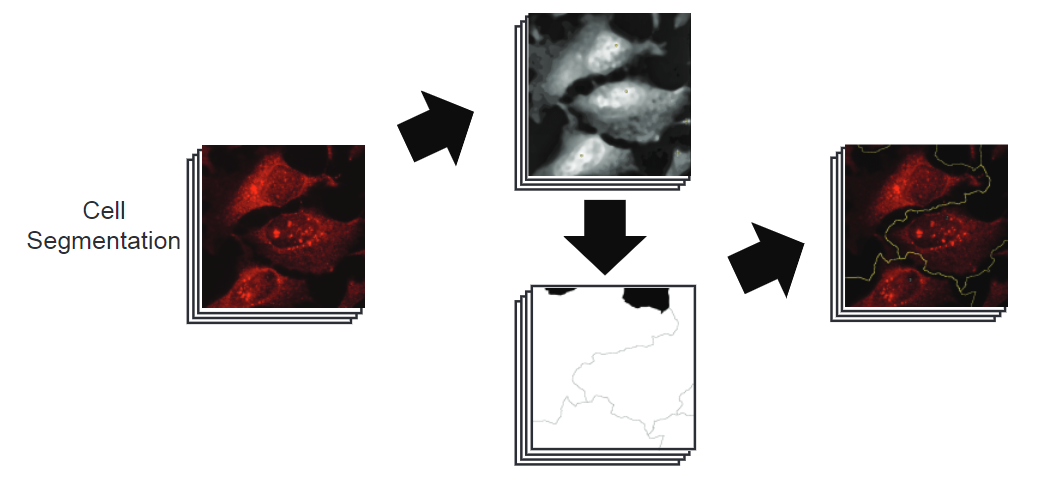
Cell segmentation
AggreCount acheives high quality cell segmentation for low to moderate density cell cultures without the need for machine learning or user selection of individual cells. AC creates a composite image between the cell bodies and nuclei images, enhancing the signal of both. Using the composite image, local maxima are determined using the “Find Maxima…” function in ImageJ. From each of these maxima, a watershed algorithm determines the borders between each cell and creates a Voronoi diagram. This diagram is used to capture cell segment ROIs. These ROIs are checked for nuclei and ROIs that do not contain nuclei are removed. Additionally, maxima (cells) that occur too close to the image border are excluded. Find Maxima documentation